Articles by "Jeera"

Showing posts with label Jeera. Show all posts


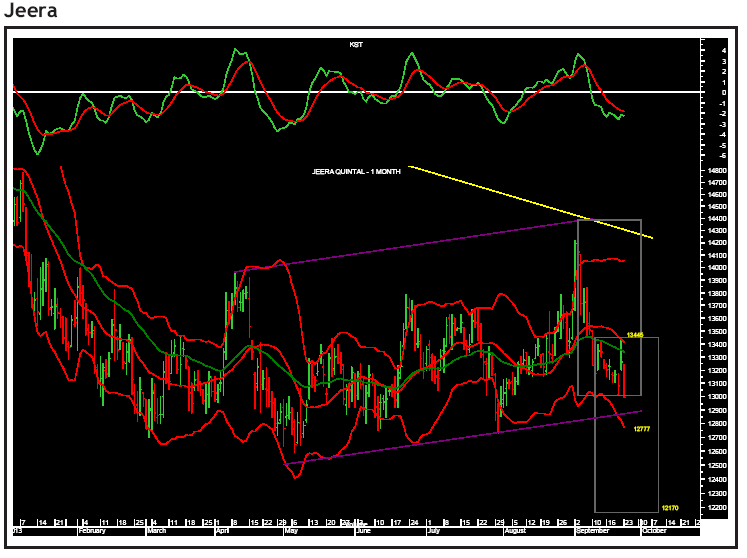
NCDEX jeera is moving up in a channelised manner since the beginning of February. It has formed a channel within a channel. The move that has started from the March low has now reached near a crucial resistance zone. This leg has achieved 161.8% of the equality target and retraced 78.6% of the previous fall. It has also halted near upper ends of both the channels. The short-term momentum indicator has been stretched to the overbought zone. Thus the agri commodity can go for a correction. Rs16,670-16,625 will be the key area on the downside. On the higher side, Rs17,670-18,185 will act as a key resistance area.


NCDEX jeera has fallen signifi cantly in last few weeks. It has fallen towards the lower end of the reverse channel. On the higher side, it is facing resistance near the junction of the 40- day exponential moving average and the daily upper Bollinger Band. It is trading within this range for a last few sessions. Thus the agri-commodity is in a make or break zone. The short-term momentum indicator has completed its pull-back cycle whereas the medium-term momentum indicator is in a bearish mode. Thus unless the swing’s high of Rs.16,675 is crossed the commodity is likely to slide down. The key levels on the downside will be Rs15,100 and Rs.14,530.

Jeera futures ended the day lower on short selling amid higher arrivals. The NCDEX Jeera April delivery ended the day at Rs9965, down Rs 125 or 1.24% over last close. Cumin seed is likely to drop further on bounty crop amid weak export demand at present.

The market sources suggested that the total domestic Jeera production is estimated at 55-60 lakh bags in the current year against the previous estimates of 45-48 lakh bags. This is mainly due to strong production estimates in Gujarat. The prices will also be pressurized by fresh supplies in local mandies. Traders are expecting that arrivals are likely to gain momentum in the coming days on the account of rising new supplies from Rajasthan.


Jeera failed to recover further as short selling emerged triggered by higher arrivals. The counter touched almost six year low with prices hitting low of Rs 9870 level. The counter ended the day at Rs9965, down Rs 125 or 1.24% over last close and the open interest added 147 tonnes to 9,699 tonnes, indicating short selling. Technically, the counter is likely to find support at Rs 9870, Rs 9800 and resistance is at Rs 10,000, Rs 10,100 per quintal.

The adjoining chart is a weekly chart of NCDEX jeera October contract. We can observe that jeera had formed an impulse on the downside. It retraced up to the 20- daily simple moving average and faced severe selling pressure at the crucial resistance. The weekly momentum indicator has given a negative crossover which indicates that every rise should be sold into. Currently it is trading near the lower end of the bearish flag pattern. Also a crucial medium term rising trend line (shown in blue colour) is providing it support. We expect the flag pattern to break on the downside with a target of Rs11,500 in the coming weeks. Our initial target placed at the weekly lower Bollinger Band has already been achieved. The stop loss should be placed at Rs13,800, which is the weekly upper Bollinger Band.

The adjoining chart is a chart of NCDEX jeera October contract. We can observe that jeera had formed an impulse on the downside. It retraced up to the 20-daily simple moving average (DSMA) and faced severe selling pressure at the crucial resistance. The daily momentum indicator has a negative crossover which indicates that every rise should be sold into. In the last trading session it broke below the previous swing’s low which indicates that the next leg on the downside has already begun which should take the agri-commodity to the daily lower Bollinger Band placed at Rs12,777 and below that we expect the target of Rs12,170, which is the equality target. The stop loss should be placed at Rs13,445, which is the 20-DSMA.

The adjoining chart is of NCDEX jeera October contract. We can observe that jeera has completed a five-wave decline on the downside. In the last trading session it gave a positive close which means that the move is complete and we will get a retracement of the fall. We expect jeera to retrace its recent fall and expect it to retrace upto Rs13,700, which is the 20-daily simple moving average and above that it can retrace upto Rs14,100, which is the 61.8% retracement of the fall. Traders can play the retracement with a stoploss at Rs13,350 for a target of Rs14,100 on the upside. Positional traders can go short on the agri-commodity around Rs14,100 levels with a stoploss at Rs14,300, which is the 78.6% retracement of the fall.

The adjoining chart is a weekly chart of NCDEX Jeera. We can observe that Jeera was trading in a sideways manner since April this year and has range broken out on the upside. It faced resistance at the downward sloping trendline (Yellow colour) and closed negative for the second consecutive week. It is currently trading below the 20- and 40-weekly moving averages and the weekly momentum indicator has a given a fresh negative crossover. In terms of price pattern it has formed a Bearish Flag pattern which is expected to break on the downside. The reversal of the bearish stance is placed at Rs13,800 - Rs13,850, which is the area of the weekly upper Bollinger Band. The target on the downside is Rs12,800, which is the weekly lower Bollinger Band.


Since Jeera has broken down from the wedge pattern it has fallen sharply. The fall is unfolding in a channelised manner and is breaking up into lower degree waves. Recently a lower degree fourth wave bounce has been formed. It faces resistance near the upper channel line, the 40-daily exponential moving average and the daily upper Bollinger Band. Thus the upside is caped at the high of Rs12,580. On the downside the low of Rs11,275 and the lower channel line (Rs10,750) are short-term targets.


Jeera has been in a downtrend. It has broken the rising trendline decisively. Thus it has broken down from the wedge pattern. It has fallen towards the weekly lower Bollinger Band, which is expanding, indicating that further fall is likely. The weekly momentum indicator is in sync with the bearish breakout. However the daily momentum indicator is showing a positive divergence. Thus a short term bounce is possible, which should be used as a selling opportunity. The channel target on the downside is Rs10,250. Reversal can be trailed to the 20-weekly moving average (Rs14,300).


Jeera has fallen below the 20-weekly moving average (WMA; Rs14,558) and the 40-weekly exponential moving average (WEMA; Rs14,763), which are now acting as resistances. Jeera is falling down as a follow-through of a bearish outside bar that was formed on the weekly chart. The weekly momentum indicator is also showing weakness. It has triggered a bearish crossover. Unless the high of Rs15,010 is crossed the agri commodity is likely to fall towards Rs13,400 (the rising trendline). Whether Rs13,400 holds will decide the future course of action for jeera.

Author Name

Contact Form

Name

Email *

Message *

© All Rights Reserved 2008-2009,Shubhlaxmi Investments. Powered by Blogger.