2012


The adjoining is a continuous chart of MCX Mentha oil.We can observe that Mentha oil after giving a break out of the triangle has given a run up sharply and is nearing its crucial resistances placed at Rs1,400 and Rs1,416. The momentum indicators have a positive crossover and we expect the rally to continue up to the crucial resistances placed at Rs1,400 and Rs1,416. Traders can trail their stop loss at the swing low of Rs1,304.


The following chart is of MCX mentha oil October contract.Mentha oil has been correcting sharply for the past few trading sessions. Currently it is trading near its crucial support zone placed around Rs1,140 and Rs1,160. We expect mentha oil to hold near the crucial support zone. The momentum indicators have a negative crossover indicating some downside in the agri commodity. Thus, as soon as we get a positive daily close one should go long for the targets of Rs1,236, which is the area of wave 4, and Rs1,266, which is the 20-daily simple moving average.The reversal of the bullish stance is placed below the crucial support of Rs1,140.

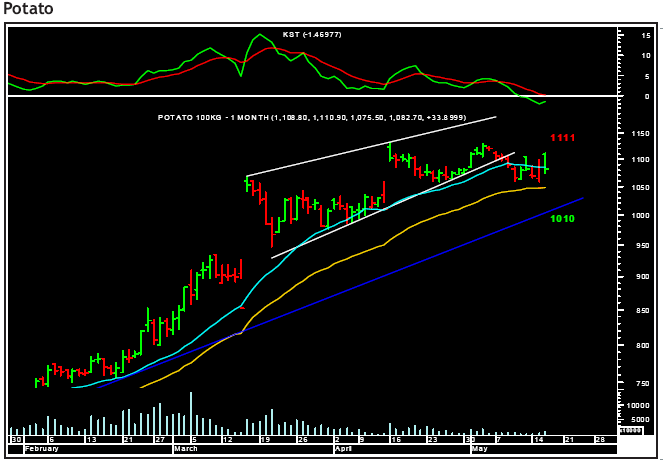
MCX Potato has been in an uptrend. However the rally seems to have matured at least from the short-term perspective. It has recently formed an ending diagonal. The last leg of the pattern has got truncated and the price has broken on the downside. It has done a minor degree pullback and is geared for the next leg down. The daily momentum indicator is showing a negative divergence and has triggered a bearish crossover. This will accelerate the price action on the downside. The target on the downside is the medium-term rising trendline ie Rs1,010. The reversal has been placed above the high of Rs1,111.


NCDEX Chilli is falling towards the long-term rising trendline. The commodity had taken support near a medium-term falling trendline however it could not surpass the 20-DMA. In terms of the wave structure one leg is pending on the downside. This leg will take Chilli to the long-term rising trendline as the equality target meets the same. The medium-term falling trendline will act as an intermediate support (Rs4,579). On the other hand, the 20-DMA (Rs5,057) and the swing high (Rs5,174) are the key resistances, which will act as the reversal for the bearish view.


Since Jeera has broken down from the wedge pattern it has fallen sharply. The fall is unfolding in a channelised manner and is breaking up into lower degree waves. Recently a lower degree fourth wave bounce has been formed. It faces resistance near the upper channel line, the 40-daily exponential moving average and the daily upper Bollinger Band. Thus the upside is caped at the high of Rs12,580. On the downside the low of Rs11,275 and the lower channel line (Rs10,750) are short-term targets.


Soybean broke out from the triangle on the upside and rallied towards the previous highs. It halted there for a week and ultimately surpassed the hurdle of Rs2,824 and Rs2,826. The breakout occurred along with high volumes. Consequently the agri-commodity achieved and even surpassed both the equality targets. Though the momentum indicators are in an overbought territory they are holding strong and unless weakness is seen in the price action the rally is likely to continue. From medium-term perspective 161.8% retracement mark (Rs3,580) and upper end of the rising channel (Rs3,830) will be the targets. On the other hand, Rs3,146 will be the reconsideration level.


After falling from Rs6,612 to Rs3,688, NCDEX dhaniya formed a bearish triangle. The last leg of the pattern got over near the key resistance zone of 40-weekly exponential moving average and the weekly upper Bollinger Band. The weekly momentum indicator is placed near the equilibrium line and can start new cycle down. The daily momentum indicator has already started a new cycle on the downside. On the daily chart the key moving averages were been broken in the last session. The short term target is Rs3,830, below which the next leg down will start unfolding. The equality target is Rs2,685. The reversal can be trailed to Rs4,535 with tight reversal at Rs4,370.


NCDEX RM Seed is trading in a long-term rising channel.It recently overshot the upper channel line twice; however it couldn’t sustain there. The daily as well as the weekly momentum indicators didn’t support the breakout as they both were showing negative divergence. The daily momentum indicator has triggered a bearish crossover. In terms of wave structure RM Seed has formed the first leg of the fall and has bounced thereon. In the last session it formed an inside bar, which is a beginning of the next leg down. Thus unless the high of Rs3,989 is crossed the agri-commodity is expected to undergo a correction. The key levels on the downside are equality target (Rs3,700) and 61.8% retracement of the previous rally (Rs3,530).


MCX mentha oil in the last few months had run up sharply. After achieving multiple equality targets the commodity has formed a channelised correction. The correction found support at the crucial support zone of the 40-daily exponential moving average and the daily lower Bollinger Band. From the support junction mentha oil has formed a higher top higher bottom, which is a sign of beginning of an up trend. It has crossed the 20-daily moving average. The channel breakout level is Rs2,330. The targets beyond that are Rs2,564.8 and Rs2,735. The reversal can be assumed below the low of Rs2,021.

After the first leg of the fall, ie. from Rs766.9 to 674, NCDEX refined soy oil formed a pullback. The wave structure shows that it was a complex corrective structure. In terms of Fibonacci retracement the pullback retraced nearly 78.6% of the fall. The agri commodity is now set for the next leg down. The daily momentum indicator is also showing a negative divergence. Unless the key Fibonacci retracement (Rs748) is crossed on a closing basis the targets on the downside are Rs674 (the low) and Rs654 (the equality target).

Crude palm oil had taken support at the rising trendline. Since then it has been riding the up trend. However recently it has formed an ending diagonal and has broken on the downside. This indicates that the rally has matured atleast from short-term perspective. The daily momentum indicator has given a fresh sell signal. At this level risk-reward ratio is also extremely favorable for bears. Hence one can short the commodity with reversal above Rs572.4 on a closing basis. The targets would be Rs555 and Rs541.

Jeera has been in a downtrend. It has broken the rising trendline decisively. Thus it has broken down from the wedge pattern. It has fallen towards the weekly lower Bollinger Band, which is expanding, indicating that further fall is likely. The weekly momentum indicator is in sync with the bearish breakout. However the daily momentum indicator is showing a positive divergence. Thus a short term bounce is possible, which should be used as a selling opportunity. The channel target on the downside is Rs10,250. Reversal can be trailed to the 20-weekly moving average (Rs14,300).

Soya bean has given a breakout from a triangle formation on the weekly charts. Soya bean is trading well above its 20- and 40-weekly moving averages of Rs2,427 and Rs2,410 respectively. The momentum indicators have given a positive crossover and are above the equilibrium line. We are expecting Soya bean to trade with a positive bias with target of Rs2,949 in the short term with the key reversal levels at Rs2,668.


NCDEX pepper was trading near the lower end of the medium-term rising channel. The weekly lower Bollinger Band provided support to the agri commodity and push it up. The price has crossed the 40-Weekly Exponential Moving Average (Rs31,500) and the 20-weekly moving average (Rs33,500). The weekly momentum indicator has triggered a bullish crossover. Hence pepper seems to have started a new move on the upside. Unless it breaks the 20-weekly moving average on a closing basis the channel targets are Rs40,900 and Rs45,900.


NCDEX chana was trading in a range bound manner for several weeks. The consolidation formed a large triangle and broke out on the upside. It has also retested the trendline and has resumed the rally. The daily momentum indicator is in line with the price action whereas the weekly momentum indicator has given a fresh buy signal. Thus short- term as well as medium-term trend for chana is up.The targets are Rs3,940and Rs4,100 (the equality targets).The reversal would be below Rs3,421.


Jeera has fallen below the 20-weekly moving average (WMA; Rs14,558) and the 40-weekly exponential moving average (WEMA; Rs14,763), which are now acting as resistances. Jeera is falling down as a follow-through of a bearish outside bar that was formed on the weekly chart. The weekly momentum indicator is also showing weakness. It has triggered a bearish crossover. Unless the high of Rs15,010 is crossed the agri commodity is likely to fall towards Rs13,400 (the rising trendline). Whether Rs13,400 holds will decide the future course of action for jeera.


The NCDEX guar seed has been trading in a range. Structurally it is forming a triangle. The 20-daily moving average and the lower end of the rising channel are there to provide support. In the time the commodity has consolidated the daily momentum indicator has cooled off. Unless the swing low of Rs11,035 is broken the view remains bullish. The break-out level on the upside is Rs12,730. The channel target is Rs15,400.


MCX mentha oil has started correcting from the high of Rs1,619. It has fallen from the daily upper Bollinger Band towards the 20-daily moving average. In the last week it had formed a doji at weekly upper Bollinger Band suggesting a loss of momentum on the upside. As a result, the commodity is falling. The daily momentum indicator has given a sell signal. The targets on the downside are Rs1,440 (the daily lower Bollinger Band) and Rs1,360 (the 78.6% retracement mark).

As evident from the chart, the commodity has been finding support near its 50% Fibonacci retracement level that is around Rs2,437. For the last couple of trading sessions it has been finding support near this area. Going forward,the immediate resistance is placed at Rs2,490, which is the falling trend line resistance. Once that is taken off bulls will take charge of this commodity and head higher towards Rs2,470 and Rs2,606. The reversal of this view is placed at Rs2,399, which is 61.8% retracement level.


As evident from the chart, the commodity has found resistance at the upper end of the daily Bollinger Band and is currently trading below its 20-daily moving average (Rs1,253). The daily momentum indicator is in sell mode indicating a halt in the uptrend that started from the lows of Rs1,100. Hence in the short term it is likely to correct lower towards Rs1,200, which will be the 50% retracement of the rise from Rs1,100-1,300. The reversal of the view is placed at Rs1,277 where the upper daily Bollinger Band is placed.

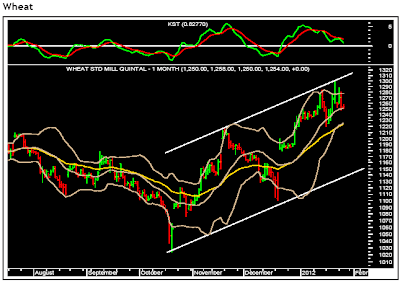
NCDEX wheat has been trading near the 20-daily moving average and the daily upper Bollinger Band for the last few sessions. It recently faced resistance near the upper end of a rising channel. The daily Bollinger Bands are squeezing and the daily momentum indicator shows that they are likely to expand in favour of bears. The key resistances on the upside are Rs1,287-1,300. On the flip side the agri commodity is expected to test the 40-daily exponential moving average, the daily lower Bollinger Band (Rs1,225) and below that the 40-weekly exponential moving average (Rs1,185).

The NCDEX cotton seed oilcake seems to have completed a three-wave pull-back. It has done a deep retracement of the previous fall. From the upper end of the channel the agri-commodity is now expected to travel southward. The daily momentum indicator has given a sell signal from an overbought level. The intermediate and lower channel lines are near Rs1,260-1,215 respectively. The reversal has been kept at Rs1,360.


As evident from the chart, the commodity is nearing the 20-weekly moving average, which is currently placed at Rs4,605. Hence this would be a key make or break level and once the price closes above this area on a weekly basis it is likely to target Rs4,865/5,211. The momentum cycles are in buy mode on weekly and daily time frames suggesting bulls have an upper hand in the short and medium term. Hence any correction should find support at the 20-daily moving average, which is currently placed at Rs4,120.


As evident from the chart, the commodity is nearing the key resistance zone of 50% retracement level, which is currently placed at Rs3,276, and the gap area (Rs3,297). Also the 40-daily exponential moving average is placed at Rs3,295 and hence it is the major hurdle for bulls going forward. On the lower side, it is likely to retest the lower trend line around Rs3,044 in the short term.


As evident from the chart, the commodity has been correcting from the high of Rs2,659 and is now nearing the key support zone of 50% retracement level of Rs2,214- 2,660 swing. The daily momentum indicator is in sell mode but is likely to finish its down cycle in the coming few days. Also, the prices are nearing the lower daily Bollinger Band that is currently placed at Rs2,460. Hence the area of Rs2,437-2,460 is likely to act as a key support area in the short term. Aggressive traders can accumulate in this area with a stop placed at Rs2,385 (61.8% retracement) on a closing basis.

Author Name

Contact Form

Name

Email *

Message *

© All Rights Reserved 2008-2009,Shubhlaxmi Investments. Powered by Blogger.